The measurement system

Four layers.
No black box anywhere in them.

Twenty-five facts roll into seven abilities, which roll into five HR scores. Every weight on this page is the weight the product uses. If a number ever surprises you, you can walk down the layers until you reach the single answer that moved it.

The design constraint was blunt: an HR director has to be able to defend any figure in this system to the person it describes. That rules out proprietary composites, and it is why the partial-data rule below is as conservative as it is.


Layer 4 · roadmap

Business linkage

Attrition against Turnover Risk, delivery pace against Team Dynamics.

Layer 3

Five HR scores

The five questions an HR director has to answer this quarter.

Layer 2

Seven abilities

Weighted clusters. Where growth and gaps become legible.

Layer 1

Twenty-five facts

Raw metrics straight out of the games. Immutable once written.

Interactive

Trace any number
back to its source.

Click a fact, an ability or a score. The map lights everything it feeds and everything that feeds it — with the actual weights, from the same dataset the configurator runs on.

Layer 1 · 25 facts

Layer 2 · 7 abilities

Layer 3 · 5 HR scores

The map scrolls sideways on a narrow screen →

L1 Facts

Twenty-five metrics, twelve games. Written once, never edited.

A fact is what a game observed.

Not what the player said about themselves — what they did. Twenty-two of the twenty-five are deterministic formulas over recorded choices: same input, same output, every time. The other three read free text with a model.

22

Deterministic

A rule over recorded choices. Costs nothing to compute and never varies.

3

AI-scored

Free text read by a model. If it is unavailable, the cluster recalculates without it rather than blocking the session.

9

Inverted

A high raw value is the bad news. Polarity is declared, never inferred.


#MetricGameWeekTypeAbility
1Decision AccuracyDecision SprintW1DirectDecision-Making
2Pressure DeltaDecision SprintW1DirectDecision-Making
3Reasoning QualityDecision SprintW1AIDecision-Making
4Signal DetectionSignal HunterW1DirectAttention
5Noise ResistanceSignal HunterW1InvertedAttention
6False Urgency RateSignal HunterW1InvertedAttention
7Deep Work PlacementTime ArchitectW1DirectEnergy
8Cognitive EnduranceTime ArchitectW1InvertedEnergy
9Fragmentation ScoreTime ArchitectW1InvertedAttention
10Locus of ControlControl CircleW2InvertedStress Response
11Escalation JudgmentRed Flag FilterW2DirectStress Response
12Sustainability IndexRecovery ArchitectW2DirectEnergy
13SBI Feedback QualitySBI Feedback SprintW3AICommunication
14Feedback ToxicitySBI Feedback SprintW3InvertedCommunication
15Recognition SpecificitySBI Feedback SprintW3AICommunication
16Blame AvoidanceDifficult Conversation 360W3InvertedSafety & Voice
17Conflict NavigationDifficult Conversation 360W3DirectCommunication
18Voice BehaviourCan You Say This Out Loud?W3DirectSafety & Voice
19Psych. Safety BehaviourIs It Safe to Say?W4DirectSafety & Voice
20System ThinkingGo LookW4DirectSystems & Leadership
21Blame Avoidance (team)Go LookW4InvertedSafety & Voice
22Focus StabilityLeadership WeekW4DirectSystems & Leadership
23Stress Recovery RateLeadership WeekW4DirectStress Response
24Comm. EffectivenessLeadership WeekW4DirectCommunication
25Delegation QualityLeadership WeekW4DirectSystems & Leadership

Each measurement is stored as an immutable snapshot carrying its raw value, its normalised value, the session and cohort it came from, and the version of the formula that produced it. Trend, personal best and personal average are derived from that history rather than stored.

Layer 2

Seven abilities.
Weights sum to 1.00.

A fact is a number. An ability is something you can say out loud to the person it describes. Each one is a weighted sum of its facts on a 0–100 scale where higher is always better.

Ability = Σ (metric.normalised × metric.weight)

AbilityComposed ofWeight
Decision-MakingDecision Accuracy0.45
Pressure Delta0.30
Reasoning Quality0.25
AttentionSignal Detection0.35
Noise Resistance0.25
False Urgency Rate0.20
Fragmentation Score0.20
EnergyDeep Work Placement0.35
Cognitive Endurance0.35
Sustainability Index0.30
Stress ResponseLocus of Control0.35
Escalation Judgment0.35
Stress Recovery Rate0.30
CommunicationSBI Feedback Quality0.25
Conflict Navigation0.25
Feedback Toxicity0.20
Recognition Specificity0.15
Communication Effectiveness0.15
Safety & VoiceVoice Behaviour0.30
Blame Avoidance0.25
Psychological Safety Behaviour0.25
Blame Avoidance (team)0.20
Systems & LeadershipSystem Thinking0.40
Focus Stability0.30
Delegation Quality0.30
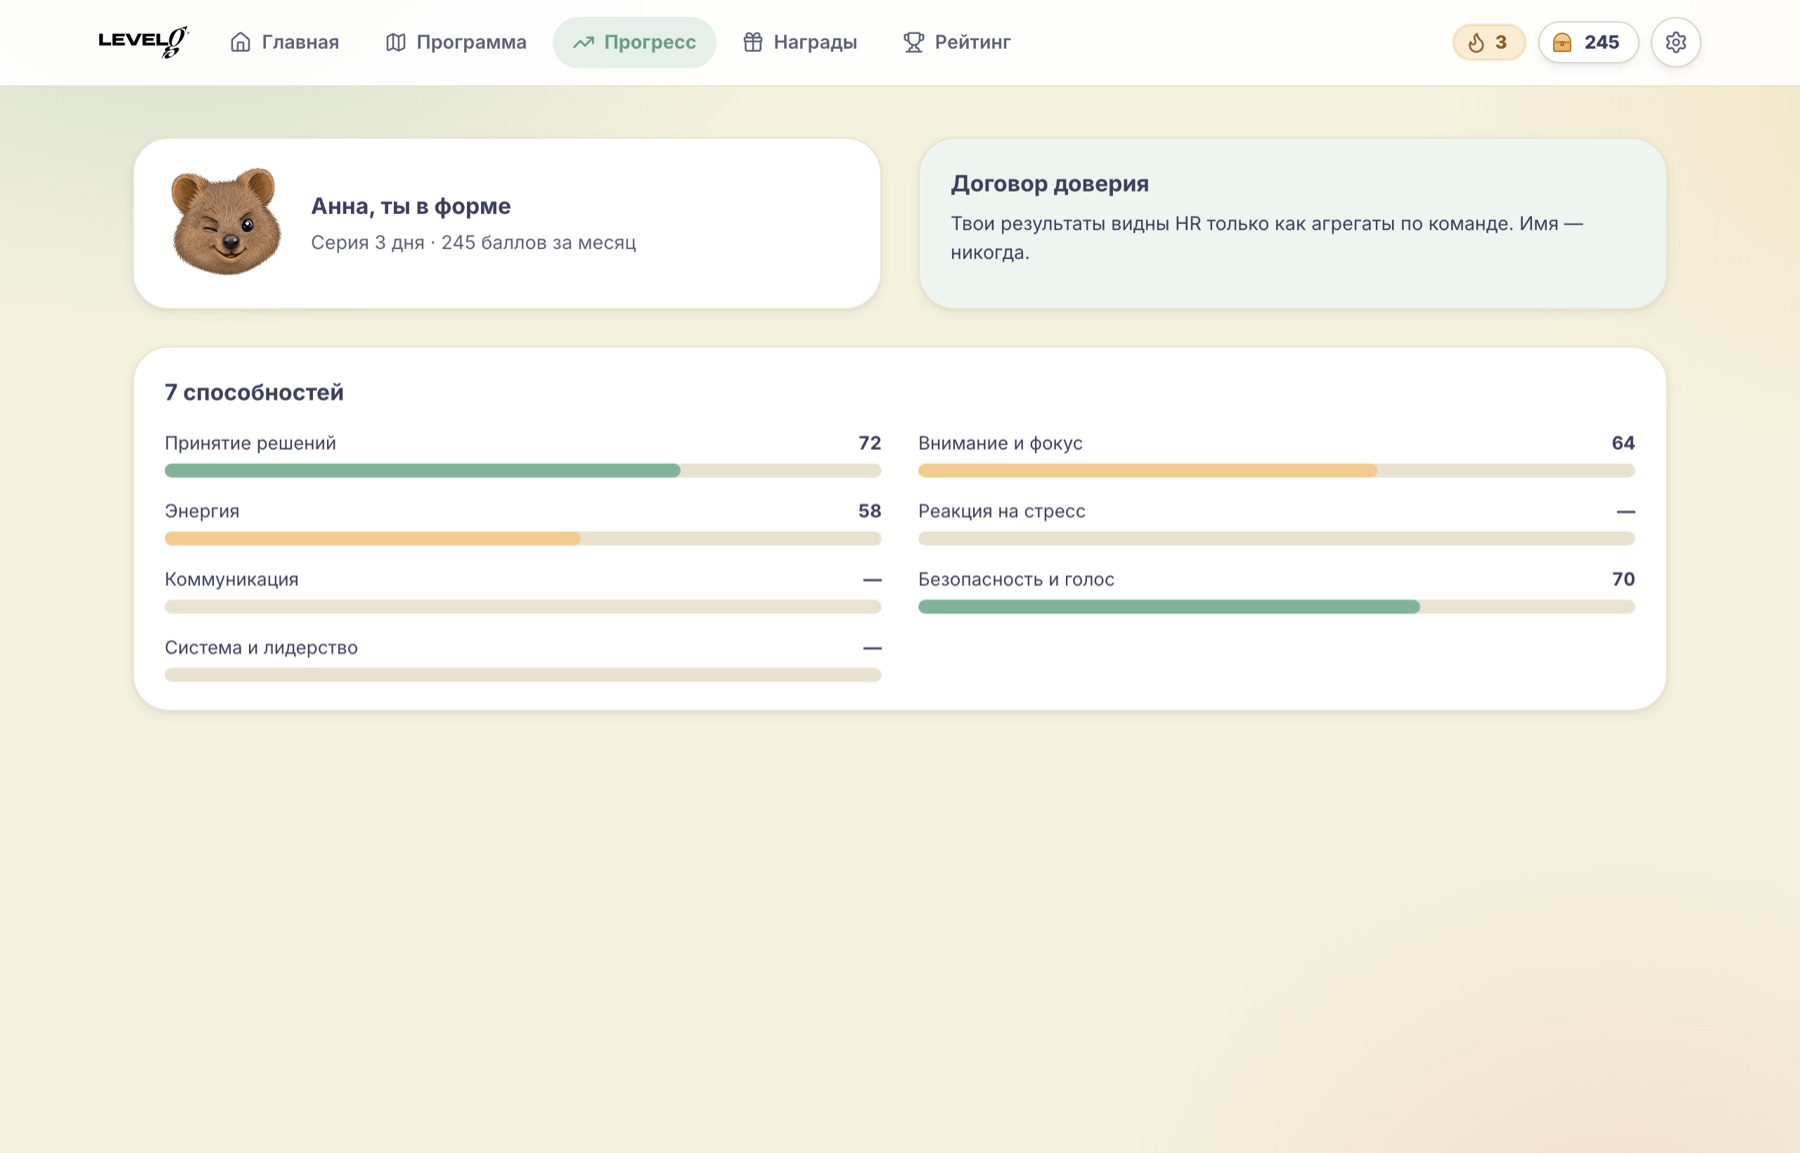
Employeeapp.levelgame · Прогресс
The Level Game progress screen showing the seven ability bars for the employee themselves.
The same seven abilities, on the employee’s own screenLayer 2 is not an internal construct the employee never sees. They get the identical seven bars, in the identical vocabulary, on the same day HR does — for themselves alone. A measurement system the measured person cannot read is a surveillance system.
✳ When data is missing

The most important rule on this page, and the least glamorous.

What happens in week one,
when four of seven abilities do not exist yet.

Games are spread across four weeks, so after week one only Decision-Making, Attention and Energy have any data at all. A system that quietly filled the gap with a neutral 50 would produce a plausible number and a wrong decision. This one redistributes instead — and says so on the face of the figure.

Worked example · Burnout Risk after week one

Full formula

Burnout = (100 − Energy) × 0.35 + (100 − Stress Response) × 0.35 + (100 − Attention) × 0.30

Stress Response has no data yet, so:

available weight = 0.35 + 0.30 = 0.65
Burnout = (100 − Energy) × (0.35 / 0.65) + (100 − Attention) × (0.30 / 0.65)
→ reported as 52~, not as 52

Inputs availableWhat the platform doesHow it is shown
0 of NNothing is computed— (dash)
1 of NComputed but withheld — one input is not a score— (dash)
2 or moreWeights redistributed proportionally52~ (tilde)
All of NFull formula52

Two consequences worth stating plainly. A preliminary score is for direction, never for a personnel decision. And a package that omits a whole week will leave certain scores permanently preliminary — which is not a limitation to discover in month three. See it for your own package →

L3 HR scores

Five questions, five numbers. Each one maps to a process you already run.

Five numbers an HR director can act on.

Succession Readiness

Who is ready for the next step? → Talent bench

Systems & Leadership × 0.35 + Decision-Making × 0.25 + Communication × 0.20 + Stress Response × 0.20

Weighted toward systemic and interpersonal capability rather than raw output, because output is what a promotion stops predicting.

Burnout Risk

Who is running out of road? → Wellbeing

Higher = worse

(100 − Energy) × 0.35 + (100 − Stress Response) × 0.35 + (100 − Attention) × 0.30

At or above 70 this raises a named alert to a single HR contact. It is one of only two places in the entire product where an individual is named.

Turnover Risk

Who might leave? → Retention

Higher = worse

(100 − Safety & Voice) × 0.40 + Burnout Risk × 0.35 + (100 − Communication) × 0.25

Kept separate from burnout on purpose. Someone can be exhausted and stay out of loyalty; someone else can be perfectly rested and leave because of the environment. Environment carries the heavier weight.

Team Dynamics

Where is the friction? → Team interventions

Safety & Voice × 0.40 + Communication × 0.35 + Stress Response × 0.25

Reported at team level as a median plus a spread plus named outlier positions — never as a bare average, because the average is exactly what hides the finding.

Development Priority

Where does the L&D budget go? → L&D planning

Needs a role profile

max_gap( Ability[i] , RoleProfile[i] ) across all seven

Not a level but a direction. It requires a filled role profile and all seven abilities — a largest gap computed over three of them is a different answer, not a rougher one.

Green · 70–100

Strong position. On the two risk scores, this band means low risk.

Yellow · 40–69

Needs attention. Read the direction of travel before the level.

Red · 0–39

Critical gap, or high risk on the two inverted scores.

Interactive

Feel the formula.

This is the real Burnout Risk arithmetic, played by hand. Drag the three abilities and watch the score move — then simulate week one, when Stress Response has no data yet.

Energy62
Deep-work placement, endurance, sustainable recovery · weight 0.35, inverted
Stress Response55
Locus of control, escalation judgment, recovery rate · weight 0.35, inverted
Attention70
Signal detection, noise resistance, fragmentation · weight 0.30, inverted
Burnout Risk
38

Benchmarks

A score with no comparison
is decoration.

Every figure is shown against three references at once, plus a trend. The threshold for calling a change real is ±3 — below that the arrow stays flat.

  • Against themselves

    Their own snapshot history

    Better or worse than before. The only benchmark shown to the player first, and the only one that motivates without inviting a ranking culture.

  • Against their team

    Team median plus spread

    Above or below colleagues. Useful, and dangerous alone — a whole team can be short on the same thing and all look fine against each other.

  • Against the role

    Role profile, set by you

    The only benchmark that supports a promotion conversation, because it is the only one that encodes what the next job actually requires.

How it reads in the dashboard

I. Ivanov — Succession Readiness: 52 ▲ +7 over 4 weeks
vs role (Team Lead)  ↓ below the bar of 70
vs team  → at the median (50)
vs 3 months ago  ↑ +12

See the maths run on your own team.

Fifteen minutes, the real product, your scenario.